- 🐘 grcMalaria R tool
- 🦢 grcMapper web-app
- 🐙 EpiGenTracker web-app
To bridge the gap between complex genetic data and practical insights for malaria control, we have developed a suite of user-friendly tools:
- grcMalaria (R package) The grcMalaria package extracts and visualises information from SpotMalaria’s Genetic Report Cards (GRC), producing intuitive geographical map of parasite prevalence, diversity and relatedness. It also identifies circulating parasite strains, characterizing their drug resistance profiles, and track their geographical spread.

- grcMapper (R Shiny web tool) grcMapper brings key functions of grcMalaria to a web interface—no coding required. Published GRC are pre-loaded and ready to go.

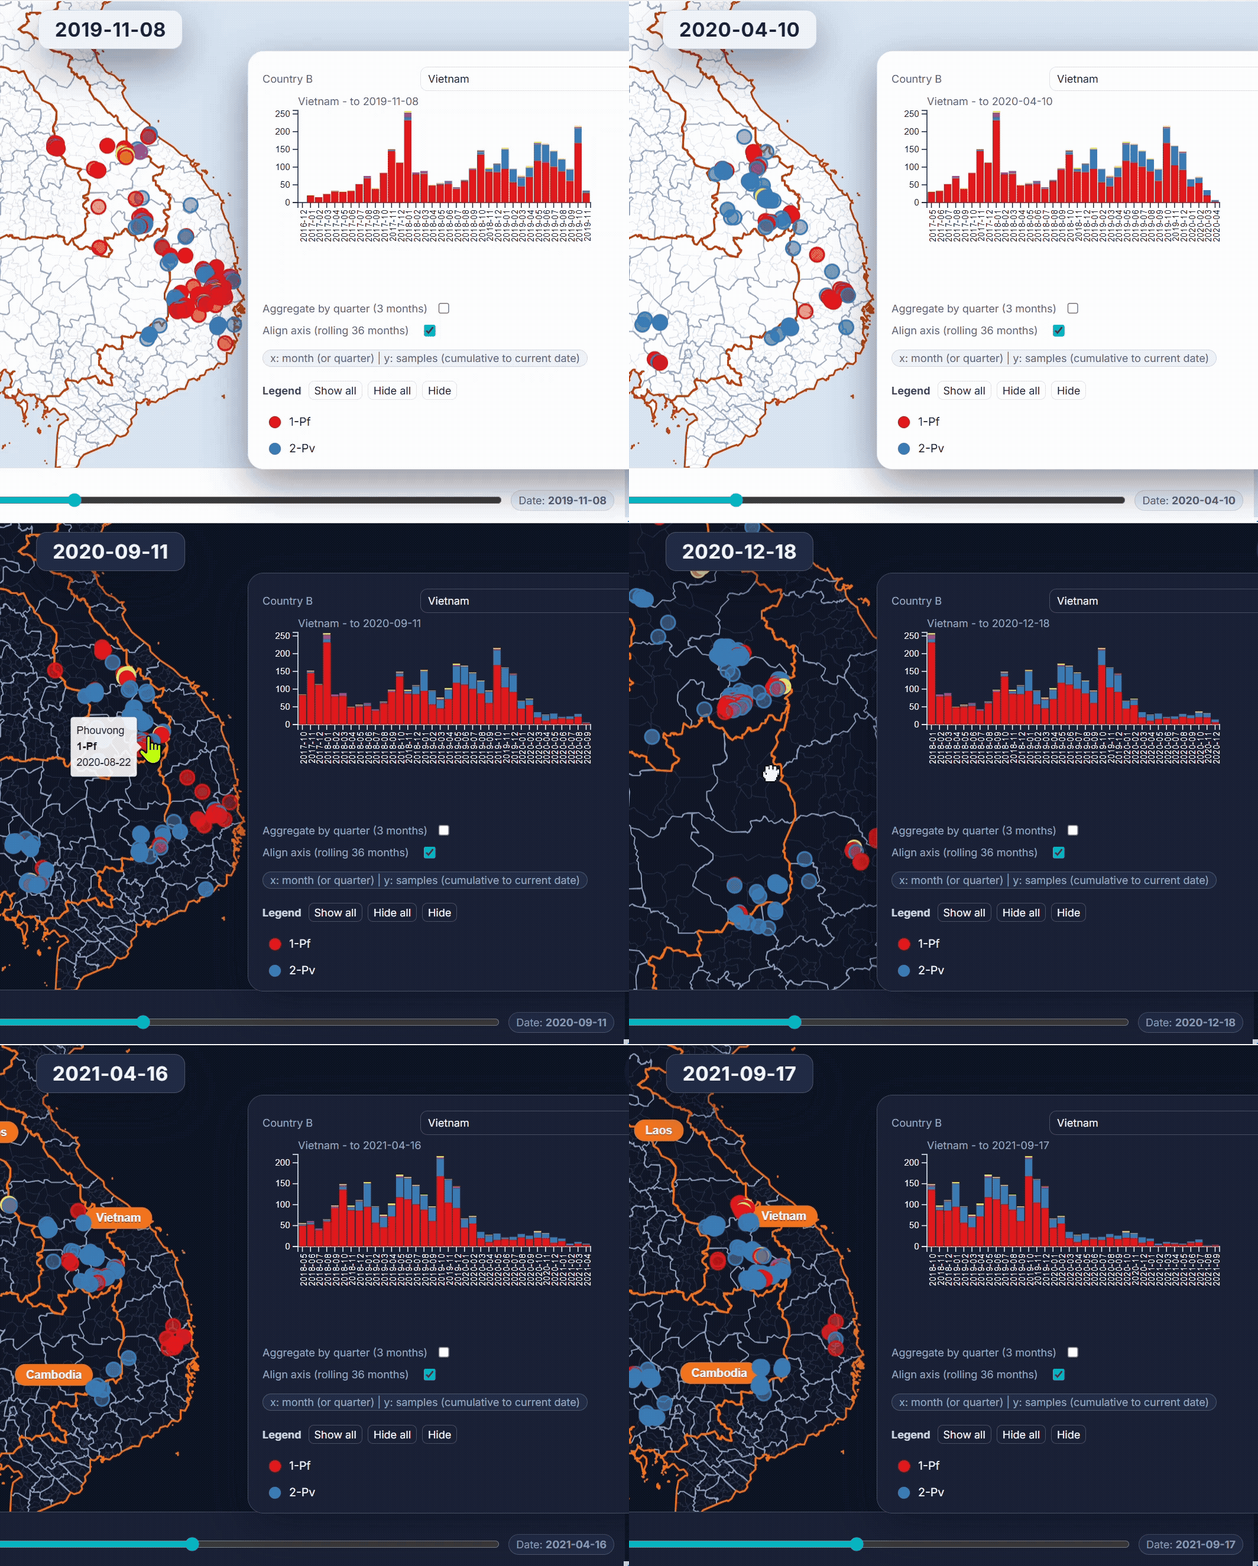
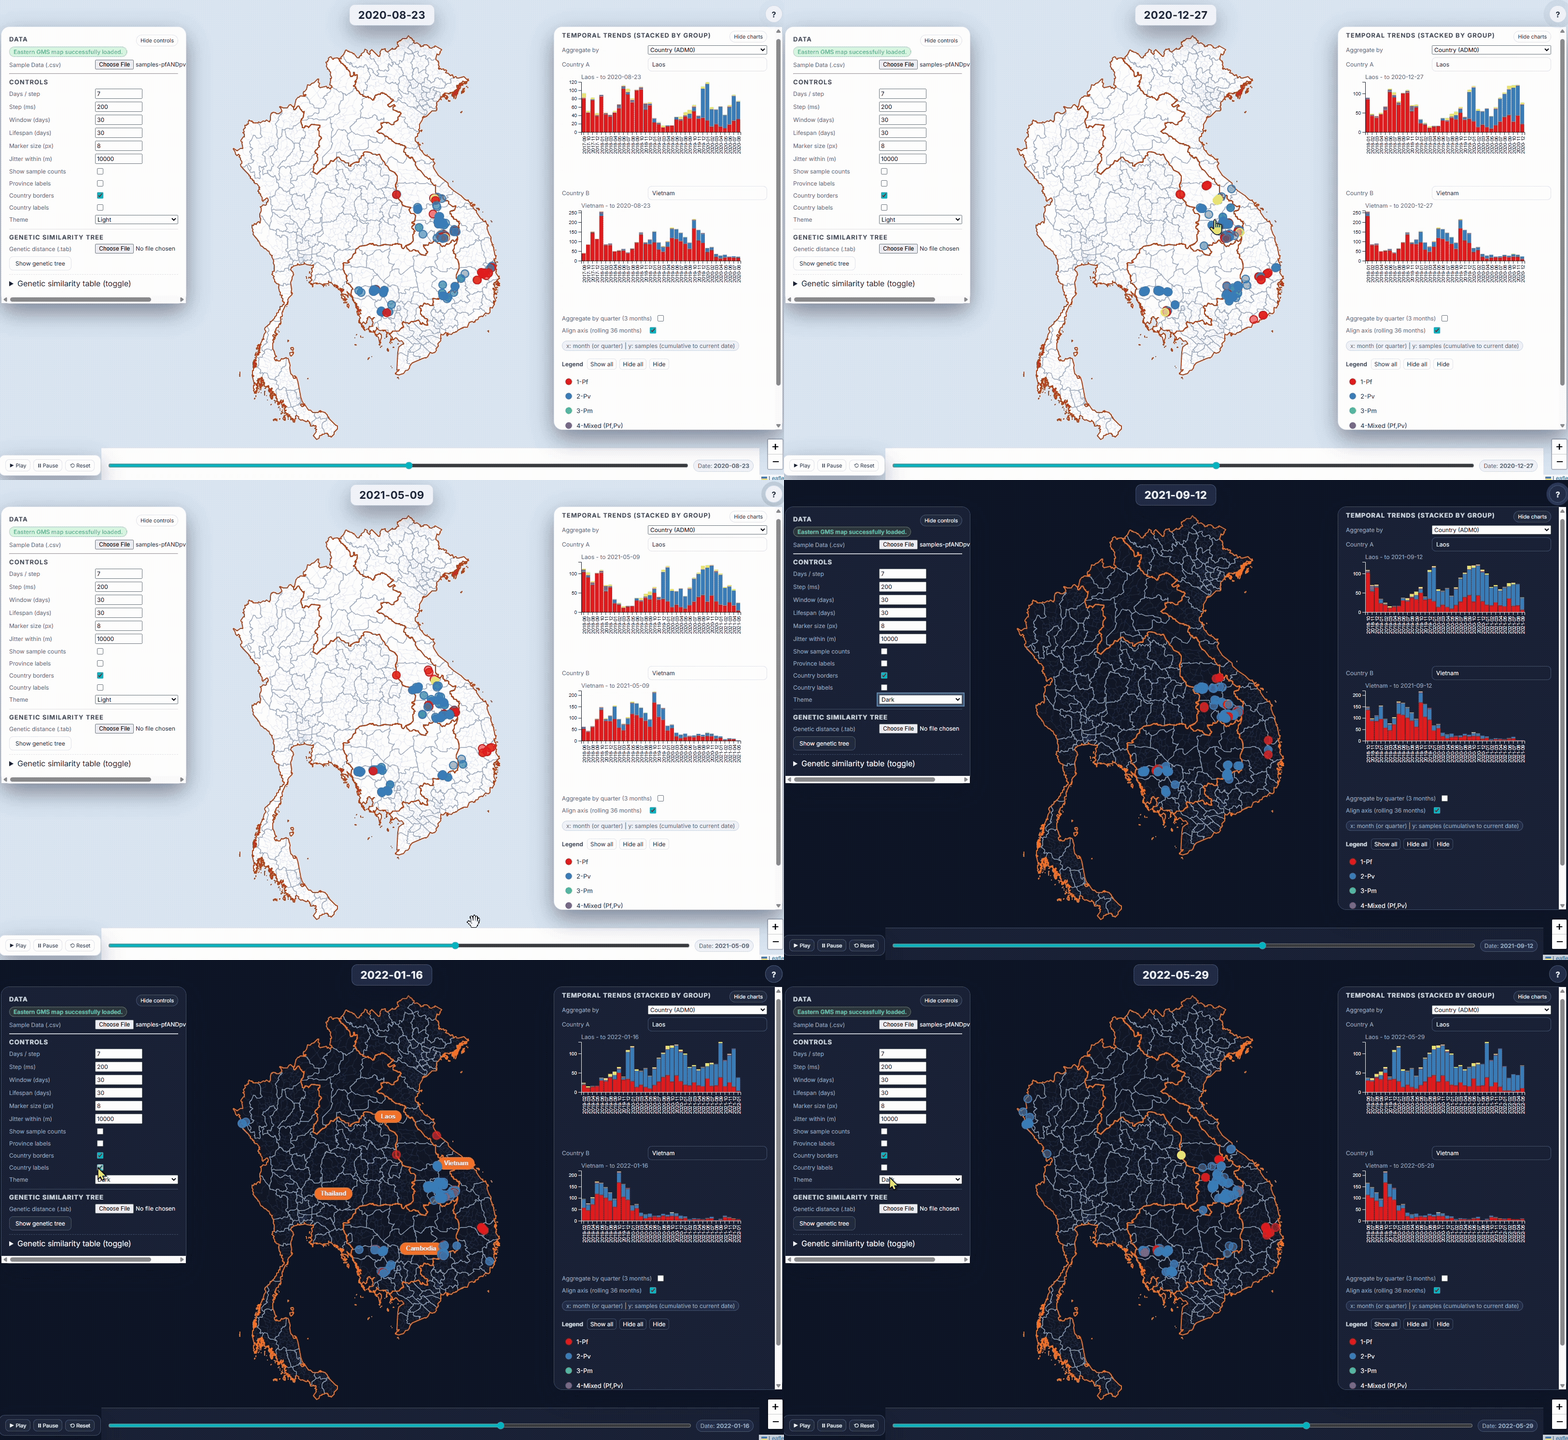
- EpiGenTracker (browser-based tool) EpiGenTracker transforms simple tabular data (.csv) into dynamic visualizations combining maps, timelines, and charts. Users can explore how samples are distributed over time, compare regions, and (optionally) visualize genetic relatedness through an interactive similarity tree.

🐘 grcMalaria R tool
An R package that turns genomic data into meaningful graphical visualizations that support NMCP activities. Specifically, it uses the GRCs as input and produces geographical maps of malaria resistance prevalence, diversity and relatedness. Suitable for: ☑️ Comprehensive genetic epidemiological analyses ☑️ Using your own GRC datasheet

A guide to the grcMalaria R package
📖 grcMalaria R package User Guide
/w=1920,quality=90,fit=scale-down)
Don’t know how to start?
Watch installation guide:
📺 Installation to R and grcMalaria R package
Watch tutorials on the grcMalaria R package (Module 2):
/w=1920,quality=90,fit=scale-down)
grcMalaria R package Github page
🦢 grcMapper web-app
Interactive web-based tool based on some functionalities of the grcMalaria R package. Produce maps without running codes. Suitable for: ☑️ quick exploration of published GRC data and generation of genetic epidemiological maps

Access to the tool
➡️ grcMapper app
🐙 EpiGenTracker web-app
Browser-based tool for visualising data across space, time, and categories using maps, timelines, charts, and genetic trees. Suitable for: ☑️ interactive visualisation of data across space and time
